Cassandra Monitoring & Observability
Unified metrics, logs, and service checks for every Cassandra cluster in one platform. Surface issues in seconds, not hours.

Unified Cassandra observability
Most teams piece together Cassandra visibility from three or four different tools. Metrics in Grafana, logs in Kibana, alerts in PagerDuty, and operational events like backups and repairs tracked in scripts or runbooks. When something goes wrong, the first 20 minutes are spent assembling context rather than fixing the problem. AxonOps brings metrics, logs, configurations, health checks, and operational alerts into a single correlated timeline, so when you open the dashboard the full picture is already there.
Metrics, logs, and operational events correlated on one timeline. Go from alert to root cause without switching tools or assembling context manually.
Failed backups, stalled repairs, nodes leaving the ring, security events. AxonOps monitors every operational domain, not just performance metrics, so silent failures get surfaced before they compound.
Knowing your clusters are healthy should not require someone to go check. Continuous monitoring across every dimension with alerts routed to the right people when something needs attention.
Teams migrating to AxonOps are seeing the difference
Customers who have moved from Dynatrace, Datadog, and JMX Exporter + Prometheus + Grafana stacks report the same thing: they finally have the depth and breadth to see exactly when and why problems happened, while spending less on infrastructure and operational complexity. High-resolution collection is only valuable if you can afford to run it at scale, and with AxonOps the overhead is low enough that 5-second resolution becomes the default, not a luxury.
The most comprehensive observability platform for Apache Cassandra
No other tool collects every Cassandra metric at 5-second resolution, ingests logs, runs health checks, and monitors all operational events in a single platform.
| Capability | What you get | Detail |
|---|---|---|
| Metrics | ||
| All Cassandra metrics | Latency percentiles, compaction, thread pools, table and keyspace metrics, all percentiles | 5-second collection, no sampling |
| JVM internals | Heap usage, GC pauses, thread counts, buffer pools | Correlated with Cassandra metrics timeline |
| OS telemetry | CPU, memory, disk I/O, network throughput per node | Infrastructure and application in one view |
| Configurations | ||
| Cassandra configuration | cassandra.yaml and runtime settings tracked per node | Per-node visibility and comparison |
| JVM configuration | Heap size, GC settings, JVM flags | Per-node visibility and comparison |
| OS and kernel settings | CPU, memory, storage layout, kernel tunings | Validate production readiness |
| Logs | ||
| Cassandra logs | system.log ingestion with full-text search | Time-aligned with metric anomalies |
| Log-based charts | Create charts from log data and display them alongside metric charts | Correlate log patterns with performance trends |
| Log-based alerting | Define alert rules that trigger on log patterns, frequencies, or error rates | Catch issues that metrics alone cannot surface |
| Health checks | ||
| Service checks | Node availability, CQL port, JMX connectivity | Configurable intervals and escalation |
| User-definable checks | Custom health checks tailored to your environment and applications | Scriptable checks with configurable thresholds |
| Availability | ||
| Node up/down | Real-time node status across all clusters | Alerts with datacenter and rack context |
| Gossip state changes | Detect nodes joining, leaving, or marked as down by the cluster | Timeline of cluster membership changes |
| Unreachable node alerting | Immediate notification when a node becomes unavailable | Routable to the right on-call team |
| Operations monitoring | ||
| Backup executions | Monitor and alert on backup job success, failure, and duration | Full execution history with status tracking |
| Repair monitoring | Track repair progress, failures, and completion across keyspaces | Alerts on stalled or failed repairs |
| Nodetool execution tracking | Monitor scheduled and ad-hoc nodetool command outcomes | Success, failure, and duration alerts |
| Security | ||
| Security events | Failed authentication attempts, unauthorized access patterns | Alerting on suspicious activity |
| Alerting & routing | ||
| Resource thresholds | Disk space, CPU saturation, memory utilization | Per-node alerting with severity levels |
| Alert routing | Route by metric, cluster, datacenter, or severity | PagerDuty, Slack, Teams, email, webhooks |
| Long-term retention | Weeks or months of metric history | Capacity planning and SLA reporting |
| Integrations | ||
| PromQL-compatible API | Query AxonOps metrics using standard PromQL from Grafana or any compatible tool | No data duplication required |
| Enterprise dashboard integration | Expose Cassandra metrics to existing Grafana, Datadog, or custom dashboards | Fits into your existing observability stack |
| Alert delivery channels | Slack, Microsoft Teams, ServiceNow, PagerDuty, OpsGenie, Generic Webhook, Custom SMTP, Email | Route to existing incident workflows |
| Governance | ||
| Role-based access | Assign edit or read-only rights per user, with access scoped to specific clusters | Prevent unauthorized changes |
| SSO authentication | Optional Enterprise SAML integration for single sign-on | Centralized identity management |
| Audit history | Full log of configuration changes, alert rule updates, and dashboard modifications | Who changed what and when |
| Automation | ||
| Terraform provider | Automate alert rules, notification channels, and adaptive alert routing as code | Codify your observability stack |
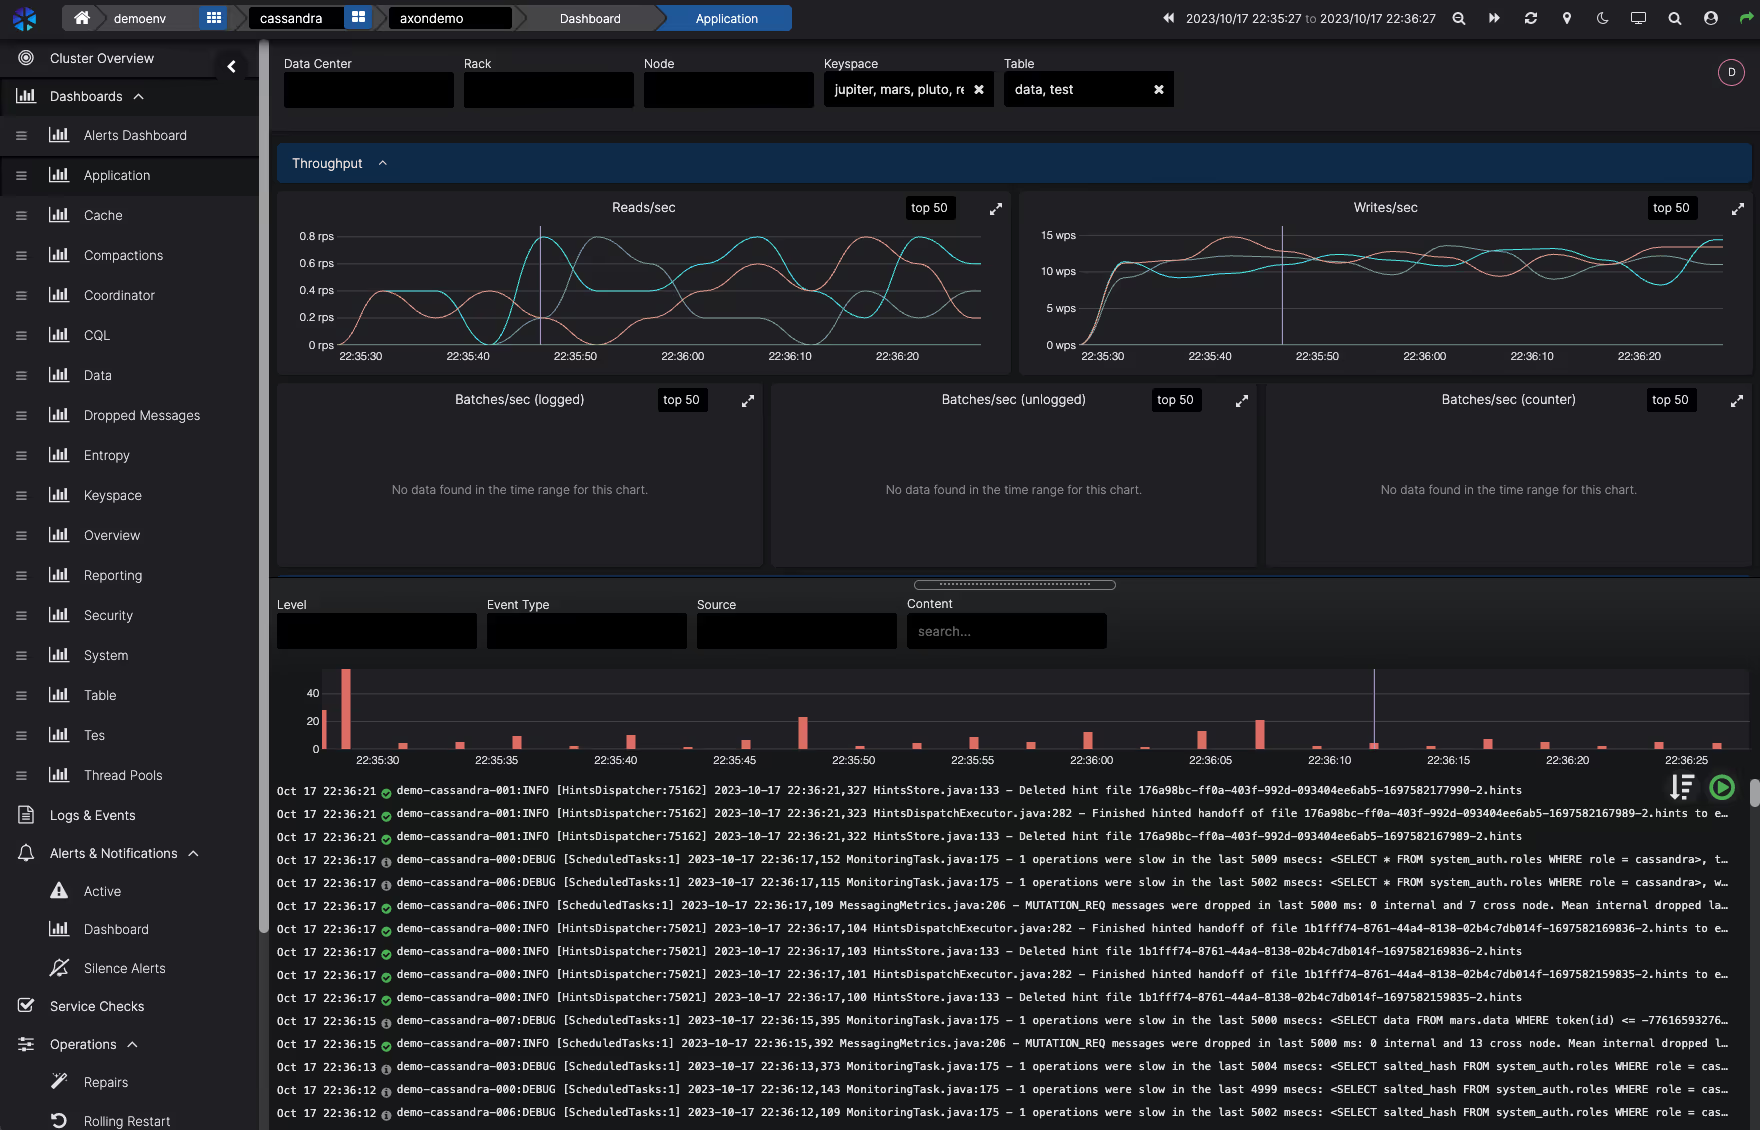
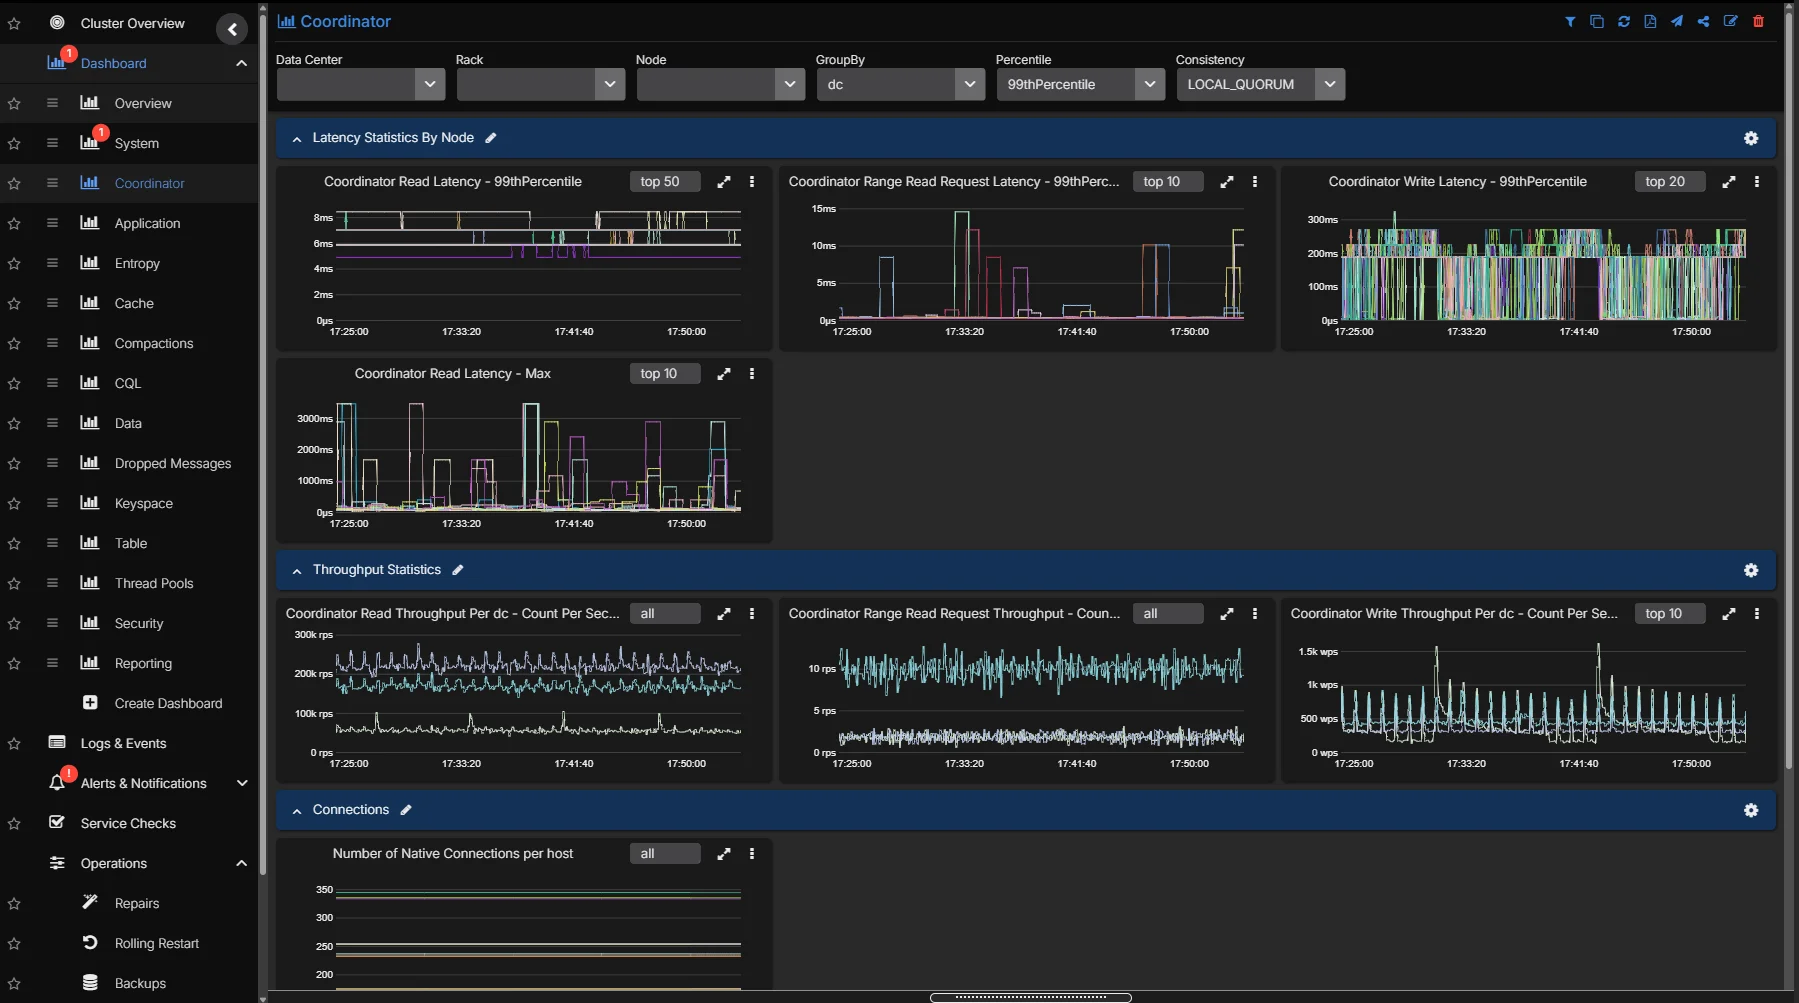
High-Resolution Metrics
Unlike other generic monitoring solutions, AxonOps collects ALL Cassandra and infrastructure metrics at high resolution, giving operators granular visibility into read/write latency, compaction throughput, thread pool utilization, and JVM behavior across every node in the cluster.
- 5-second metric resolution across every node, no sampling or aggregation
- Purpose-built collection agent with under 1% CPU overhead and no GC pressure
- Efficient binary transport protocol with delta compression, 10x less network traffic than general-purpose collectors
- Lower cloud data transfer costs for the metrics data, especially at scale on AWS, Azure, and GCP
- Pre-built dashboards curated by Cassandra engineers, ready to use immediately
- Infrastructure metrics (CPU, disk I/O, memory, network) correlated alongside Cassandra internals
- Historical data retention for capacity planning and trend analysis
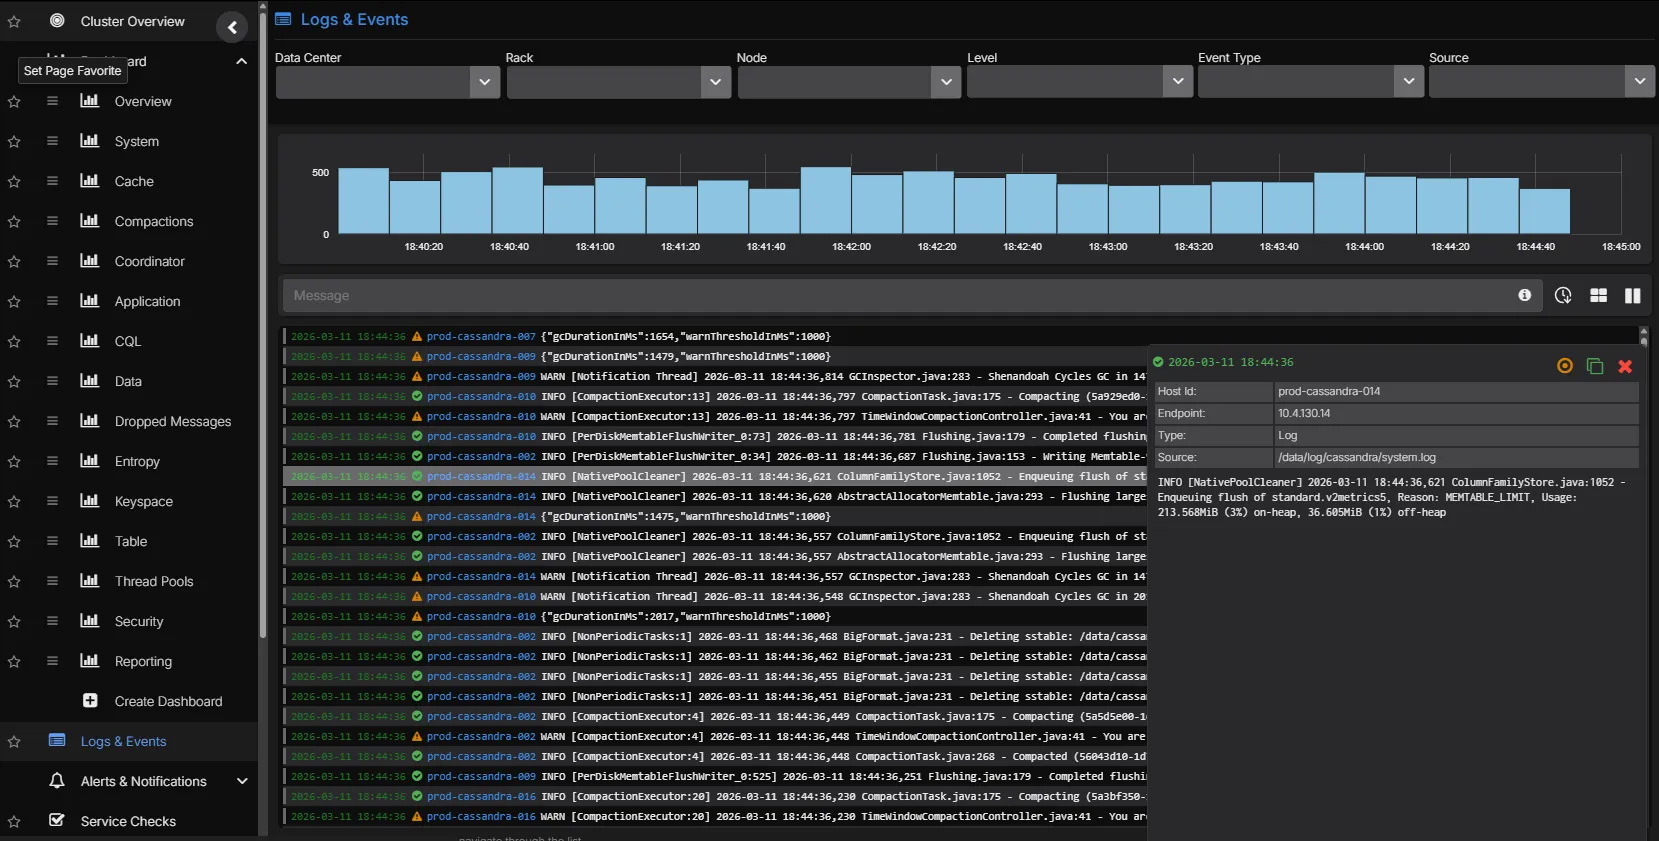
Correlated Log Analytics
Cassandra system logs, GC logs, and audit logs are ingested and indexed alongside metrics. Move from a latency spike to the underlying log entries without switching tools. Logs can be charted as time-series data and placed alongside metric charts, and alerts can be configured based on log patterns.
- Full-text search across Cassandra system.log and debug.log
- Time-aligned correlation between metric anomalies and log events
- Chart log data as time-series alongside metric dashboards
- Configure alerts based on log patterns and frequency
- Filterable by node, datacenter, log level, and custom patterns
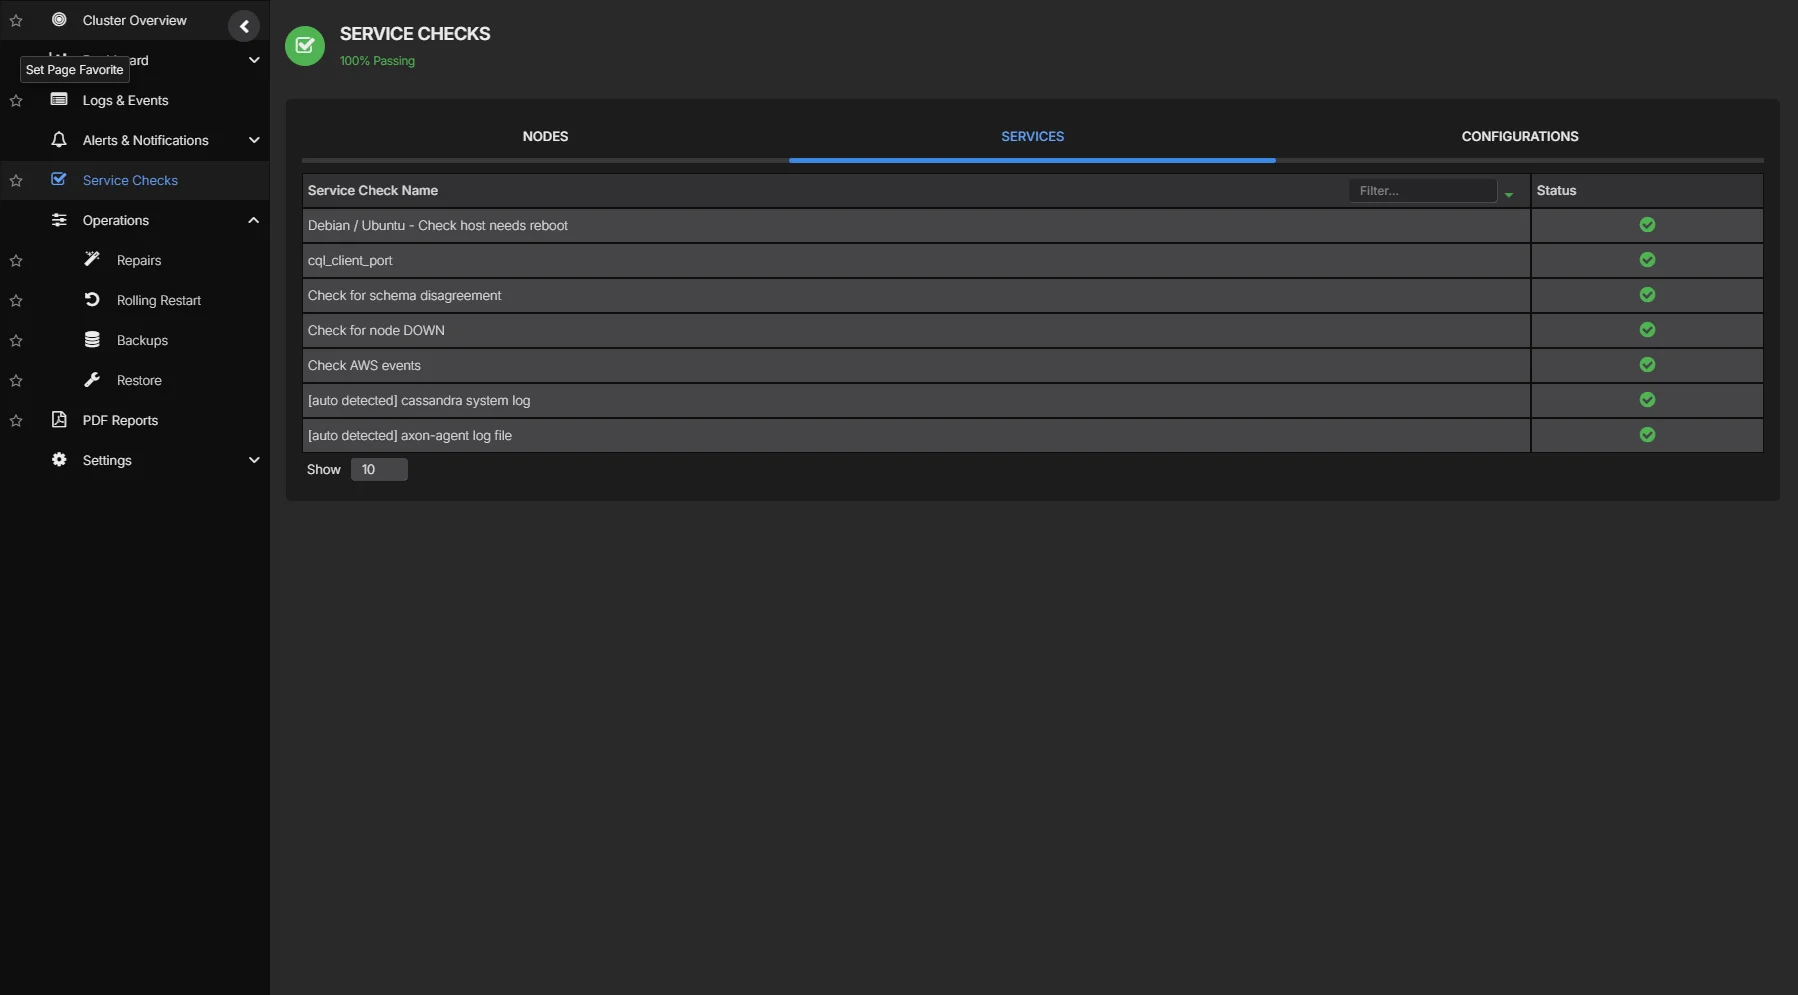
Service Health Checks
Proactive service checks continuously verify that Cassandra nodes are reachable, CQL ports are responsive, and system-level resources (disk, CPU, memory) remain within operational thresholds, catching problems before they affect application traffic.
- Node availability, CQL port, and JMX connectivity checks
- Disk space, CPU saturation, and memory utilization thresholds
- Configurable check intervals and alert escalation policies
- Cluster-wide health summary with per-node drill-down
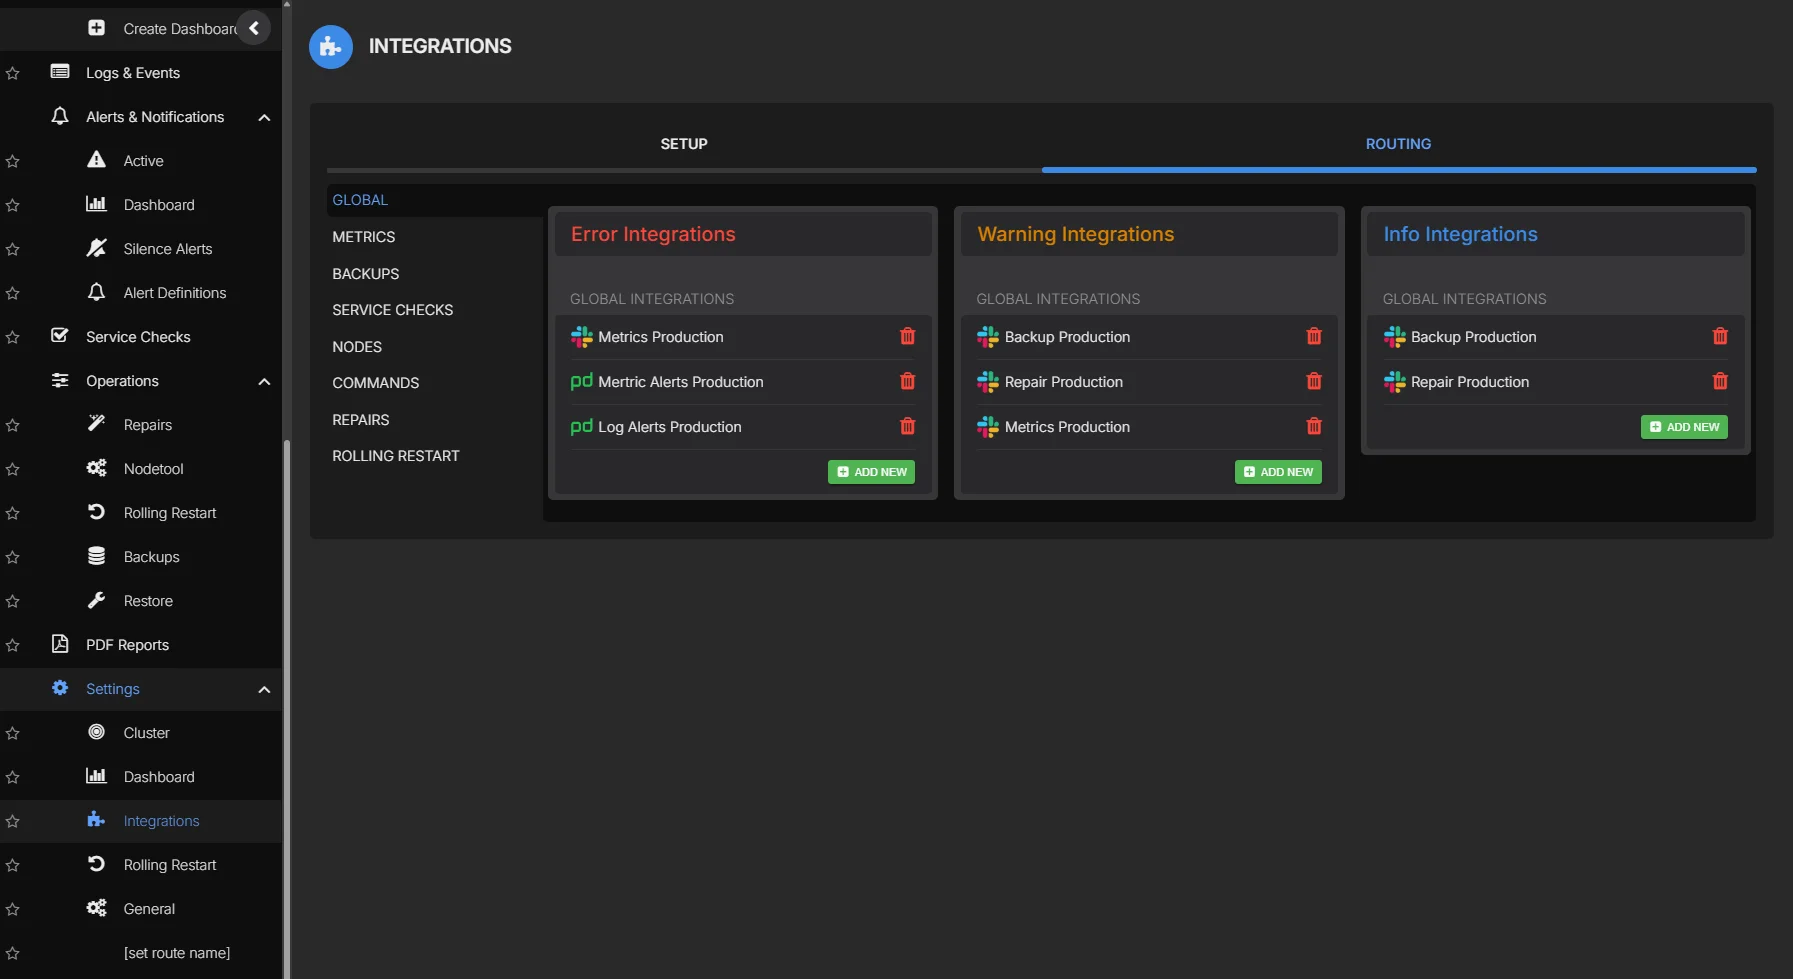
Alert Routing
No other Cassandra tool lets you route alerts from backups, repairs, nodetool executions, metrics, logs, and service checks to different endpoints from one platform. An SRE team gets PagerDuty on node failures. A DBA gets backup alerts in Slack. A developer gets query latency warnings in Teams. Each signal goes to the right people through the right channel.
- Route alerts from every operational domain: metrics, logs, backups, repairs, nodetool, service checks, and security events
- Each alert source can be routed independently to Slack, Microsoft Teams, PagerDuty, OpsGenie, ServiceNow, webhook, or Custom SMTP
- Scope rules by cluster, datacenter, metric type, or severity
- Duration qualifiers to suppress transient spikes and reduce false positives
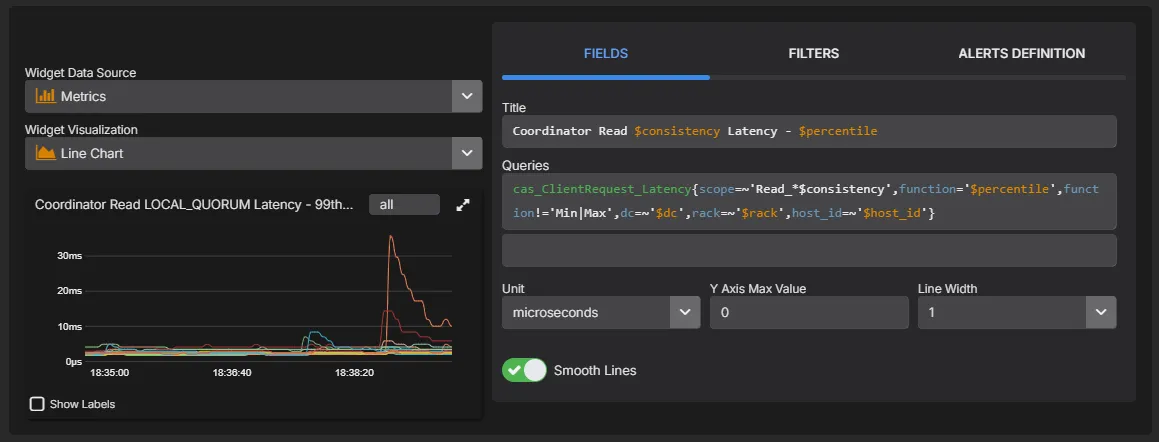
PromQL Queries & Custom Dashboards
Build custom dashboards and charts using a PromQL-compatible query language. Query any metric collected by AxonOps, create ad-hoc visualisations for troubleshooting, and build team-specific dashboards tailored to your operational workflows.
- PromQL-compatible query language for all collected metrics
- Build custom charts and dashboards alongside pre-built views
- Ad-hoc queries for live troubleshooting and investigation
- Expose metrics to external dashboards like Grafana via the PromQL-compatible API
See Cassandra monitoring in action