Apache Cassandra is an exceptionally powerful distributed database used by some of the world’s most popular online services. However, the adoption of the Cassandra DB requires some fundamental disciplines to operate it effectively and ensure you are following recommended Cassandra best practice.
In this blog, we discuss the top 5 disciplines for Cassandra best practice. I have limited this blog to the top 5 as there are many other disciplines that we cannot cover in just one blog. We intend to run a series of blogs based on different areas of expertise surrounding Cassandra on this website.
1. Hardware Selection
Being a top Cassandra expert starts by selecting the best Cassandra hardware for your workload. The Cassandra DB is a distributed database that was designed in the 2000s to be deployed onto commodity hardware, and this was before the days of IaaS Cloud like AWS. Like these rack after rack of servers in large-scale data centres.

By commodity, I mean low-cost x86 servers with disks attached to them. Nowadays many people are deploying Cassandra in the public cloud. The choices of servers and disks are simply dazzling and often lead to confusion as to what instance types or disk volumes are the best for Cassandra.
When selecting the hardware for Cassandra remember what you are using Cassandra for. High resiliency, low query latency, high read/write throughput, scalability. Cassandra is designed to absolutely hammer your hardware – both compute and storage.
Disks
Use the local SSDs and not remote disks where possible. The remote storages are convenient – mounted disks survive server failures. If a server with local SSDs goes out of action in the cloud then the data is lost – which is why they’re called “ephemeral” disks.
The Cassandra DB was designed in the first place to tolerate the loss of servers through replication so why not take advantage of cheaper and faster local disks? You’ll get over 100k IOPS and GBs/s throughput, and extremely low access latency. Local disks will give you an enormous price/performance ratio advantage compared to your remote disks. The remote storage cost in the public cloud can become rather high, and you don’t get the best performance out of them.
Compute
Give each server enough CPU cores and memory. Cassandra will chew them all up when you load them up with these processes. Cassandra leverages OS page caching for your queries so the more memories you give the less it needs to access disks for reads.
With storage being extremely fast, the CPU is often the bottleneck with Cassandra these days. Do carry out performance tests and find out where your bottlenecks are.
2. Tune Your Servers and Cassandra
I see this time and time again – purchasing expensive hardware or instances but leaving the default OS and Cassandra configurations and wondering why the servers are not being pushed hard.
Linux Tuning
Linux OS distributions are great for the general workload, but the default configurations are in no way designed for the Cassandra DB workloads.
Cassandra is a database and we recommend applying a number of tuning options to your Linux servers. They’re not difficult and you’ll get better results from your Cassandra clusters. Whilst I was working for DataStax the team worked on discovering the optimal tunings for your Cassandra DB. Do follow the best practice recommendations in the links below.
https://docs.datastax.com/en/cassandra-oss/3.0/cassandra/install/installRecommendSettings.html
One interesting example worth noting here is many of the cloud instances have the OS configured so the CPU frequency scaling enabled. CPU slows down to conserve power when not too busy. This isn’t great for databases and we recommend you disable such scaling. Please read the above links and implement them for your Cassandra nodes.
There are many others that we highly recommend, including the network kernel parameters to storage tunings. Do read apply these to your automation scripts.
Cassandra DB Tuning
Cassandra configurations out-of-the-box are only good enough for your development environment. There are many tuning parameters in Cassandra and I’m not going to call out to all of them here in this blog. However, there are some of the key parameters/setups you will see an immediate effect when you change them.
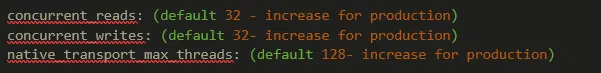
These default values will limit your read/write throughput to your Cassandra nodes. We often see Cassandra deployments with 16+ CPU cores and no matter how hard the clusters are loaded, the CPU cores are not stretched and give the wrong impression about Cassandra’s performance to the engineers using them.
JVM tuning is also important. The default is the CMS GC and although it provides great performance when tuned well it is quite a difficult beast to tame. G1 GC has simplified things for the users, but in 2022, we already have more options available. Shenandoah GC appears to provide great throughput and latency, and it’s included Azul Zulu JDK. Azul Zulu JDK & Shenandoah GC has been shown to work very well for us. Do give it a go.
You wanna see what you have configured on your Cassandra easily? Try connecting your Cassandra cluster to AxonOps and you’ll see the configurations instantly.
3. Security
I know implementing security can be painful and we see many people simply bypassing this. Many Cassandra implementations do not have any security whatsoever and I would like to encourage people to implement the basic set of security in Cassandra clusters. This is a key discipline for Cassandra best practice.
User Access / RBAC / Audits
Linux access control should be the first port of call. Have you implemented tight access control for your Linux servers in production? Do you know who has access to them? Do you know when they accessed the servers and what they did? Many data breaches occur because of insider threats, not somebody from outside trying to hack your organisation. Secure your Linux servers and audit access.
Roles in Cassandra should be enabled for both user and application access and the principle of least privilege should be applied. I know it takes some time to think about this and implement it but I see so many implementations AllowAllAuthenticator and AllowAllAuthorizer are being used.
The problem I’ve seen over and over again is that the use of Cassandra grows, and it becomes too scary to enable authentication. More tables are created and new applications start connecting in. You will then have no idea who is accessing what tables.
As best practice, we highly recommend setting up your Cassandra cluster with the PasswordAuthenticator and CassandraAuthorizer from the beginning. IMHO, AllowAllAuthenticator and AllowAllAuthorizer should be removed so users don’t have an option for such loose security.
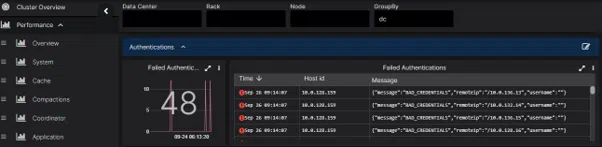
Audit logging has finally arrived in Cassandra 4.0. https://cassandra.apache.org/doc/latest/cassandra/new/auditlogging.html This was a very much needed feature in enterprises. Now that it is available, we suggest you get Cassandra 4.0+ deployed and configure this feature. If you’re unable to move on from 3.11 then how about checking out the AxonOps security dashboard?
Encryption
“Just do it”. Get into the habit of enabling TLS for your Cassandra clusters. I know that generating certs can be mind boggling for people who have never done this. There are many tutorials on how to generate certificates as well as JKS files. Why not automate the process whilst you’re doing this?
When I started my career we were using telnet to access Linux servers until SSH became the norm. TLS should be the norm in the 21st century and it should be an intrinsic part of your enterprise psyche!
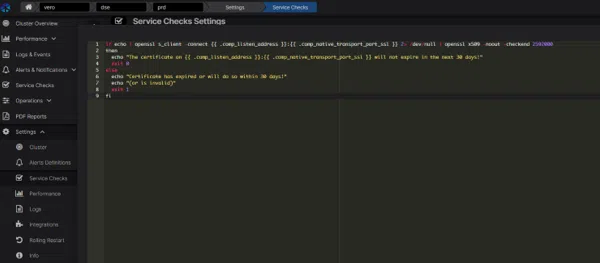
With AxonOps you can easily implement certificate expiry checks using its Service Checks facility, and a script such as below. You’ll get notified to your preferred tools like Slack / Email or even PagerDuty if your certificates are about to expire!
nodetool Security
nodetool is an essential tool for managing your Cassandra clusters. The command line interacts with the Cassandra JMX port which exposes its MBeans to execute all sorts of internal functions. As you can imagine you could potentially do a lot of damage through the JMX or using the nodetool command. By default, the JMX port is bound to localhost so only the people with access to the servers will be able to get to use the port. However, we all know that’s not really securing the system, right?
Yes, you should secure the access, and audit all the nodetool executions so you can see what has been executed on your Cassandra cluster.
There are two ways in which you can secure your JMX access – the Java way or the Cassandra way. The Java way requires you to create password files on each filesystem. We recommend using the Cassandra Integrated Auth approach for the JMX authentication. This way you will not be storing plain text password files on your server.
The setup instructions are available here – https://cassandra.apache.org/doc/latest/cassandra/operating/security.html
4. Cassandra Observability
I cannot stress enough how important it is! It’s just the fundamental part of looking after your Cassandra clusters. You have so many choices now on implementing your Cassandra monitoring so you have absolutely no excuses! Having the right kind of insight into your Cassandra DB nodes helps you identify problems quickly.
There are three aspects you will need to monitor your Cassandra clusters effectively.
- Performance metrics and historical insight
- Cassandra logs and events
- Current health (RAG status) of your cluster
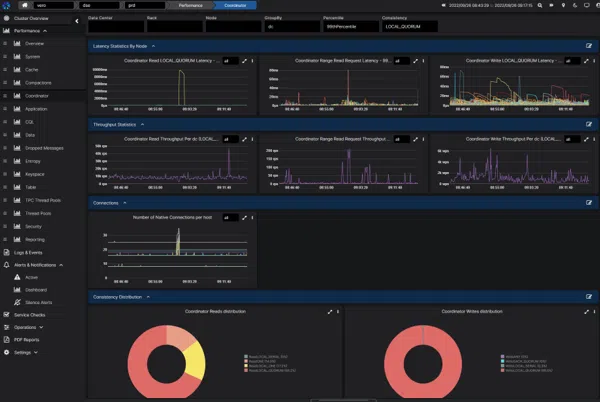
Cassandra Performance Metrics
Why do we need to monitor the metrics? Because you want to know when your queries become slow or have timeouts, and why they occurred.
Cassandra generates an enormous number of metrics through JMX and the number only increases as you add more tables. There are commercial tools like DataDog, Solarwinds, and Dynatrace for setting up your Cassandra performance monitoring, or you could go down the open source route of using jmx_exporter, node_exporter, Prometheus, and Grafana.
The trouble with all these tools is that they’re generic performance monitoring tools and not specifically designed for Cassandra. Also, you’ll find that as the number of tables you have in your cluster increase the agent starts to create some performance impact on your JVM process. Some of the commercial tools don’t collect enough metrics about Cassandra you simply don’t have enough insight to be able to resolve issues. If you want the best-of-breed Cassandra performance dashboarding look no other than AxonOps! The pre-built dashboards give you an extensive set of performance dashboards built specifically for monitoring Cassandra.
Cassandra alerts can be set up easily within these dashboards, and you can send them to different integrations, including SMTP, Slack, Teams, Pagerduty etc.
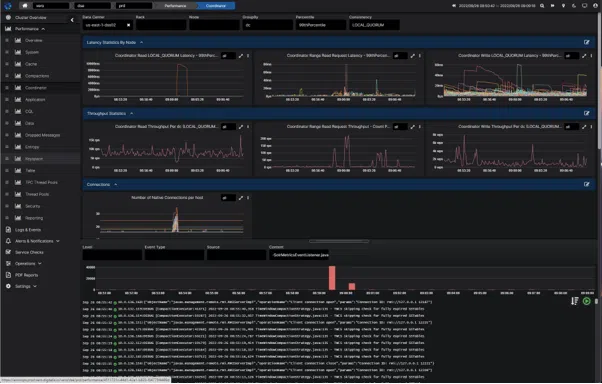
Cassandra Logs and Events
Cassandra provides a wealth of information through its logs and they can give you many clues as to why your cluster is running slowly. GCs, slow queries, large batches, too many tombstones, you name it, they’re there.
It’s important that you capture your Cassandra logs and be able to analyse them quickly, especially in the middle of the night when you get woken up by your paging system, bleary-eyed, and trawling through logs from many Cassandra servers.
There are tools like ELK, Sumologic, Datadog, Splunk, and many many more that allow you to aggregate your logs and search them. Have you ever considered using AxonOps for searching for your logs in Cassandra? Logs & Events view of Cassandra is fully integrated with Cassandra metrics dashboards. See spikes in the latency? You can home directly into the area and view the logs in the corresponding time range instantly.
Cassandra Health Status Checks
Being able to see the health status of your cluster is important. Tools like Zabbix, Nagios, and Consul allow you to define regular checks of your processes, and network ports, or running a simple query to check the health of your Cassandra servers and giving you an instantaneous heath RAG status is important.
With AxonOps you can simply define your checks – HTTP, TCP, or even scripts can be executed at regular intervals and see the health of your cluster.
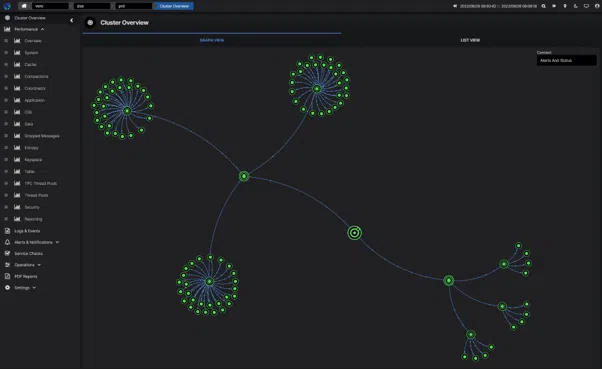
Everything from whether the node is down, or SSL certificates that are about to expire can be visible here!
5. Disaster Recovery
Having a well-documented and rehearsed Backup & Recovery process should be part and parcel of looking after enterprise databases. Many people argue that Cassandra replicates data so that they don’t need to back up Cassandra.
Well, I have had a phone call in the past where somebody had accidentally executed the development environment cleanup script against production accidentally, and wiped all data directories in production. It can easily be done, which is the scary thing. Unfortunately, this particular client had not implemented backups so there was no way of recovering the data. Well, almost. I did manage to recover most files back from the disks using recovery tools but they were lucky.
You do need to think about the Recovery Point Objective (RPO) and the Recovery Time Objective (RTO) for your Cassandra cluster when it comes to disasters based on a multitude of disaster scenarios.
Think about all possible disaster scenarios and have a plan for recovery for each scenario. Do document the steps. It’s so easy to miss something when you’re in a panic, under enormous pressure, and trying to recover a production cluster.
Backup and restore procedures for Cassandra clusters can easily be implemented using AxonOps. Why cobble together scripts when we have done the heavy lifting for you in AxonOps? AxonOps backups are highly efficient, only shipping differentials since the previous backup to remote storage locations such as the S3. You can easily create schedules for backing up keyspaces, and tables in specific data centres, racks, or nodes.
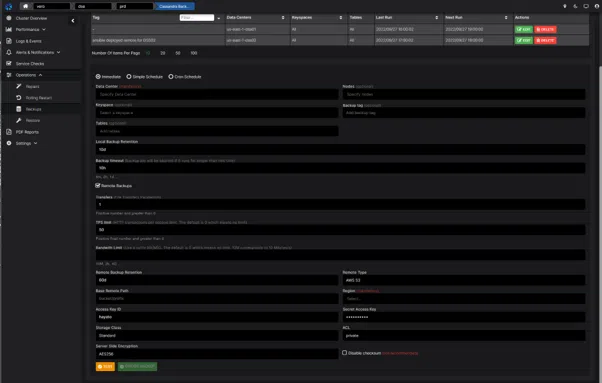
Restore procedures are also simple – see our restore documentation – https://docs.axonops.com/operations/cassandra/restore/restore-cluster-same-ip/
In AxonOps you can even produce PDF reports of your successful Cassandra backup activities in the PDF reports it generates for you.
Conclusion
These top 5 disciplines for Cassandra best practice are not hard to implement; they just require getting used to them. Doing these will help you in the long run, just at the point you get comfortable with your clusters and think everything is in good order! Do use the right tools like AxonOps.
Learn More
Watch our on-demand session with Hayato Shimizu, co-founder at AxonOps, who will guide you through the top 5 disciplines for Cassandra best practice that provides your users the reliability and performance they need.
Apache Cassandra Lunch #117: 5 Disciplines of a Cassandra Expert – YouTube