

Author: Joaquin Casares
After a brief stint away from the Apache Cassandra community, I’m thrilled by the transformative advancements and innovations that have recently shaped the Apache Cassandra ecosystem. Notably, my former colleagues at The Last Pickle, a longstanding pillar within the Cassandra community, were acquired by DataStax. Additionally, I’m excited to learn about the entrepreneurial updates of Hayato Shimizu and Johnny Miller. Together, they founded two innovative companies: first their consulting firm Digitalis.io and now AxonOps with another former DataStax employee, John Glendenning, which focuses on managing Apache Cassandra clusters.
I first started working with Apache Cassandra in 2011 at DataStax. On my third day, I was restarting servers for Netflix as a Support Engineer. During my career I’ve also been a Software Engineer-in-Test, Demo Engineer, Internal API Engineer, and Consultant, all focused on Cassandra. I frequently worked on monitoring and metrics for unrelated use cases centred around general visibility. At The Last Pickle, I worked with Alain Rodriguez to create the first version of the official DataDog dashboards which I presented at DataDog Summit 2017. A few months later, I presented enhanced Prometheus dashboards at Data Day Austin 2018.
The Metrics of Metric Collectors
Over the years I’ve gained a respect for creating dashboards that are easy to read and understand. I was the primary point of contact with 200+ organizations during my time at DataStax and most notably worked closely with T-Mobile during my time at The Last Pickle when I was not diagnosing 800-node clusters across at least 6 geo-distributed split-brained data centers. Through my experience dealing with multiple clusters and teams across various industries, I’ve noticed that the teams that had well-designed dashboards were always quickest to resolve issues. But I’ve also seen cases where the culprit for a near-meltdown was the metrics system that was entrusted to provide visibility during times of crisis.
Now, understanding the intricacies of an efficient, non-intrusive metrics system is always in the back of my mind. I’ve encountered scenarios where the choice between running blind or shutting down the system became imminent due to the destructive hindrance of the monitoring system in place.
The more I looked into AxonOps, the more the design philosophy of their agent intrigued me. The emphasis on a lightweight, non-intrusive agent capable of seamless integration with the Cassandra process promised a refreshed approach to metric collection.
DataStax open-sourced MCAC and I used the JMX Exporter’s default Cassandra configuration during my time at The Last Pickle, so I figured to run a quick test between the AxonOps agent, MCAC exporter, and JMX Exporter.
Test Environment
Infrastructure
3 Cassandra clusters of 3 nodes each were spun up on AWS as m7i.large instance types. This way, all tests could be run in parallel for quick data collection.
This setup can be seen in early startup production environments and internal projects. From experience, I’ve seen a startup’s traffic-serving production cluster last about a year without issues on m1.large instance types before needing to upgrade to m1.xlarge instance types.
Cassandra Version
Cassandra 4.1.3 was used to ensure the agents were tested against all recent bug fixes and improvements.
Cassandra 4.1.3 was the latest release at the time this test was conducted.
Java Version
OpenJDK 11.0.2 was used for all Cassandra nodes in this test.
Metric Collection
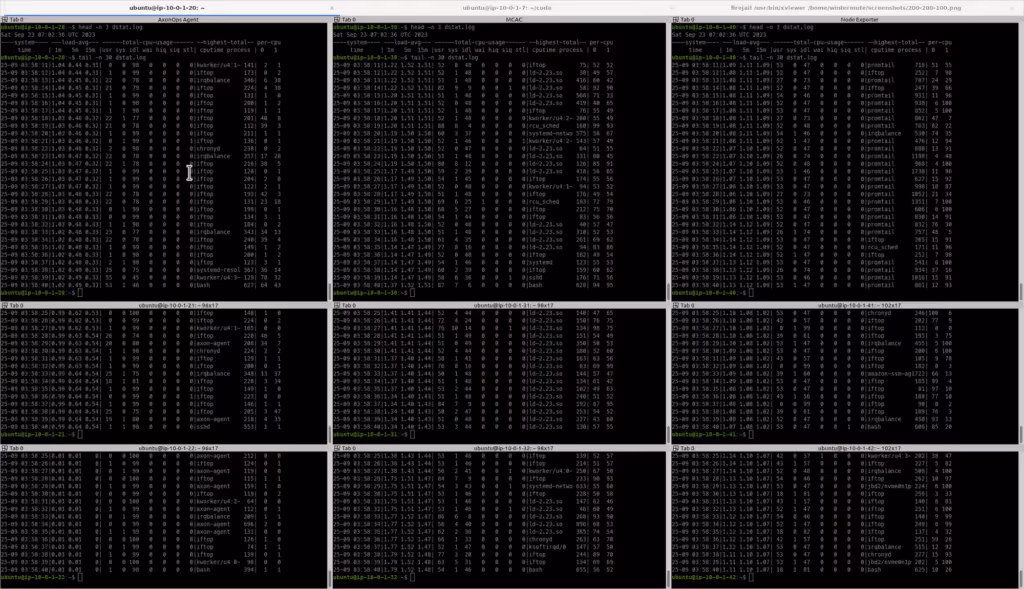
CPU and network metrics were collected at the Linux level to ensure reporting accuracy. The following two commands were used:
# cpu metrics
dstat --time --load --cpu-adv --top-cputime --cpu-use

# network metrics (Prometheus is located at 10.0.1.6)
iftop -B -f "dst host agents.axonops.cloud"
iftop -B -f "dst net 10.0.1.6/32"
Test Configurations
AxonOps Agent Configurations
I used the Axon Ops Starter plan which supports monitoring up to 6 Cassandra nodes for free. The AxonOps Agent configuration’s axon-server.hosts and axon-agent.org values were provided by the Agent Configuration wizard, which provides a preconfigured axon-agent.yml ready to be copied and pasted.
MCAC Exporter Configurations
All MCAC configurations were left at their defaults except for the collectd.conf’s Interval and Timeout settings which were lowered to 5 and the metric-collector.yaml’s metric_sampling_interval_in_seconds value was changed from 30 to 5 to match AxonOps’ default scrape resolution.
You can find the 1-line setup guide I followed in the README.
JMX Exporter Configurations
The JMX exporter had a simple installation guide and an example file that was copied onto the local config.yaml. This was the simplest exporter to set up!
For this exporter, each time Prometheus scrapes the /metrics endpoint the agent will collect and report metrics in real time. This means I’ll have to update the Prometheus configurations if I want to update the scraping frequency, but I’ll also have to be careful about how often metrics are scraped since too many requests could overload the JVM.
Prometheus Configurations
Within the local prometheus.yml, the default scrape_interval value of 1 minute was changed to scrape every 5 seconds to match AxonOps’ default granularity. As a result of an updated scrape_interval, scrape_timeout was changed from the default of 10 seconds to 2 seconds to ensure scrape requests wouldn’t overlap, causing undue load on Prometheus or Cassandra. All other configurations stayed the same.
While performing the baseline tests, scrapte_timeout was increased to match the scrape_interval of 5 seconds to avoid dropping metrics after proving a timeout of 2 seconds to be too short for the JMX Exporter.
After extending the timeout, the JMX Exporter routinely took close to 5 seconds to serve its metrics on an idle cluster, increasing the risk of dropped metrics when the cluster is under load.
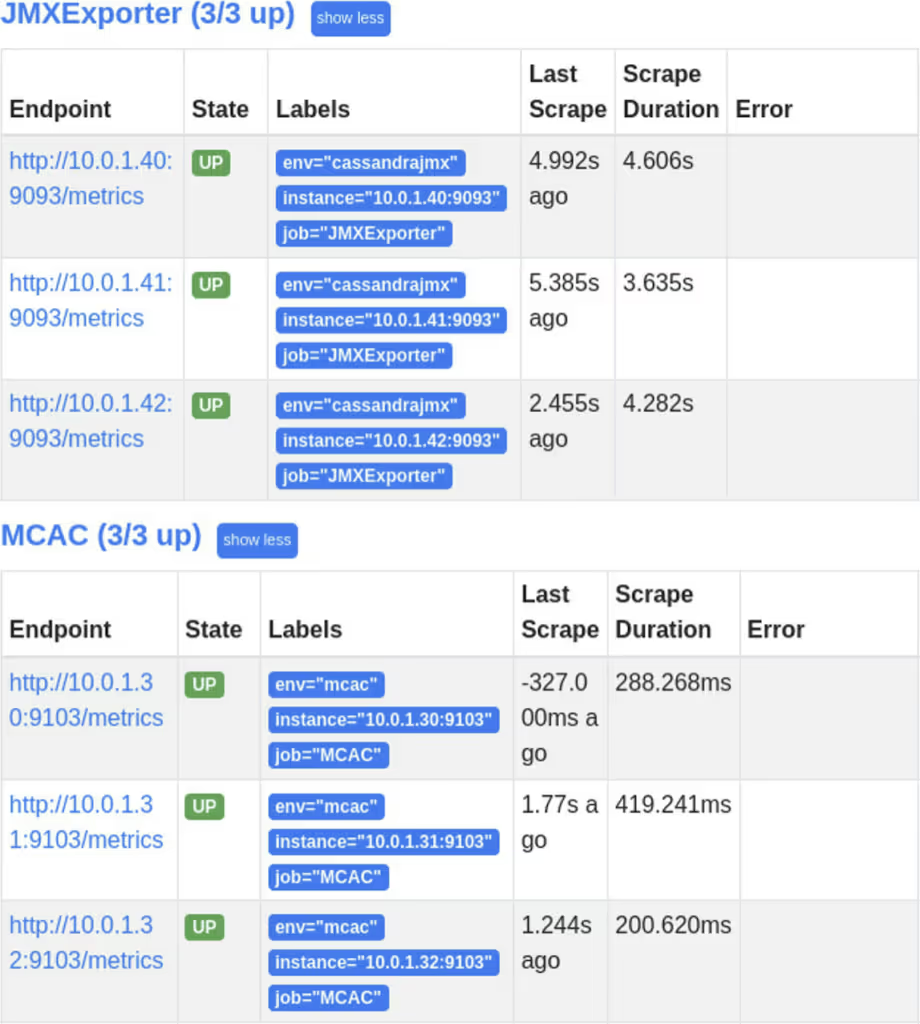
The MCAC exporter is noteworthy for having a surprisingly quick scrape time about 20 times faster than that of the JMX Exporter, due to the local cache MCAC uses.
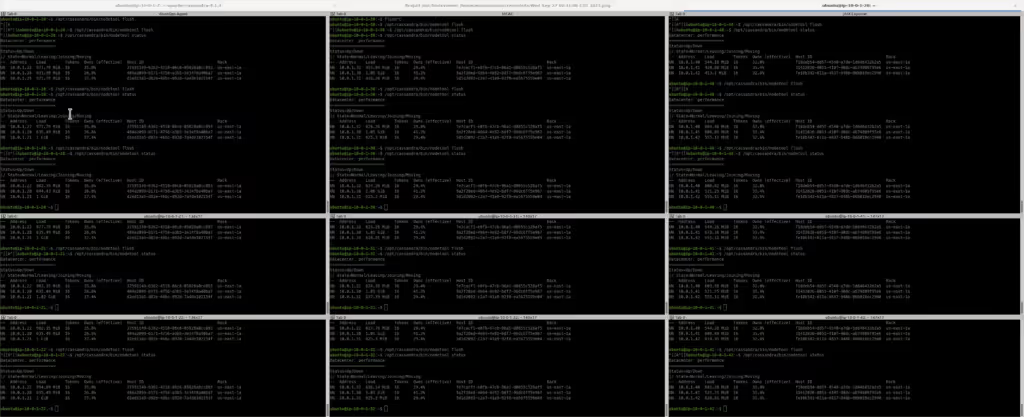
Baseline Cassandra Metrics
In preparation for the upcoming tests, I wrote a quick Python script to create 1 keyspace-table pair in a for loop. I figured 100 tables would generate enough metrics for a noteworthy comparison.
While having a single table across 100 keyspaces is not normally seen in production, having around 100 tables is commonplace. While having a large number of keyspaces adds very little overhead to Cassandra and its metrics collection, it’s typically a large number of tables, even when empty, that can cause memory pressure issues for an idle Cassandra cluster.
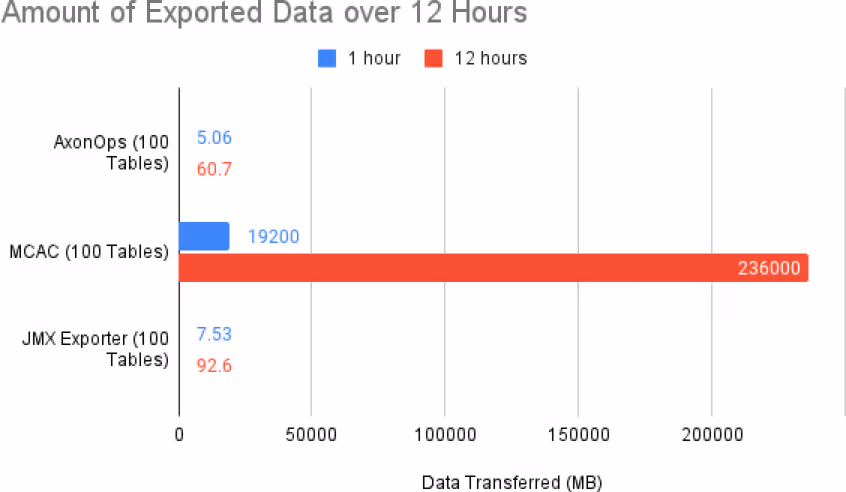
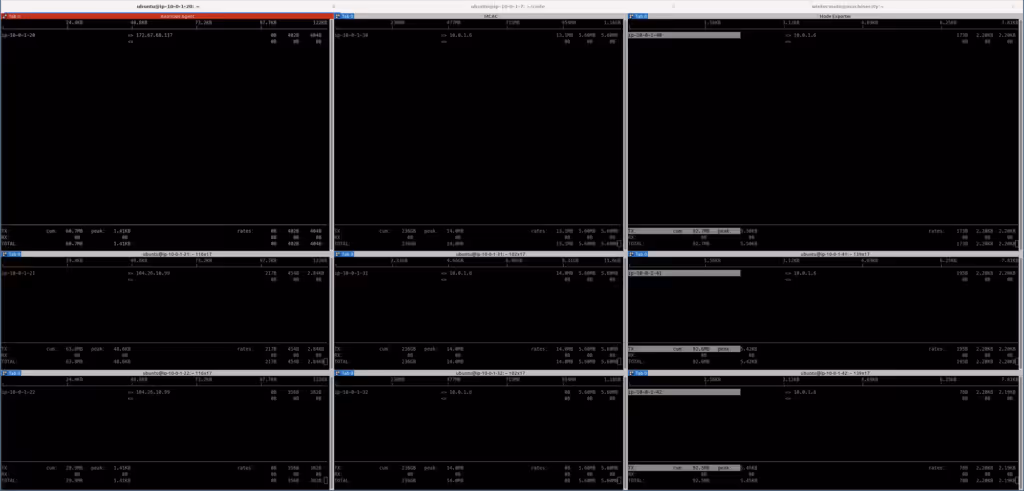
Data Transfer over 12 Hours
After 100 tables were created on each of the 3 clusters, I left the idle clusters on for 12 hours to collect the amount of data each metrics collector exported from each node. AxonOps shined by transferring only 5 MB in an hour and 60 MB over 12 hours. The JMX Exporter transferred 7.5 MB in an hour and 92 MB over 12 hours, consuming 53% more bandwidth than the AxonOps agent.
MCAC, however, was a data firehose, sending 19.2 GB of data over 1 hour and 236 GB over 12 hours when monitoring 100 tables. By comparison, this is about 4,000x more data than what the AxonOps agent exports. This bandwidth would ideally be used to serve public requests, not gather internal health metrics while potentially increasing bandwidth charges.
It is quickly apparent that the MCAC exporter web traffic is not compressed after capturing network traffic using the command tcpdump -A port 9103.
While nginx can be placed in front of MCAC’s web server, nginx is not part of the MCAC default setup. There’s no mention of enabling gzip, or any other compression, in the MCAC Readme, the packaged collectd.conf, nor the metric-collector.yaml.
It’s also worth noting that Prometheus is sending a gzip request in the HTTP header, and JMX Exporter honors this request while collectd used by the MCAC exporter does not.
Users of the MCAC exporter should be aware of this large bandwidth requirement, which could impede on the bandwidth available to serve production workloads.
CPU Load vs Number of Tables
The plan for the following measurements was to increase the number of tables, wait 15 minutes, take CPU metrics, and then increase the number of tables further.
However, the number of tables on the nodes with the JMX Exporter did not exceed 200 tables. It felt uncomfortable sending a test load to these nodes since the CPU usage was already far too high for an idle Cassandra cluster.
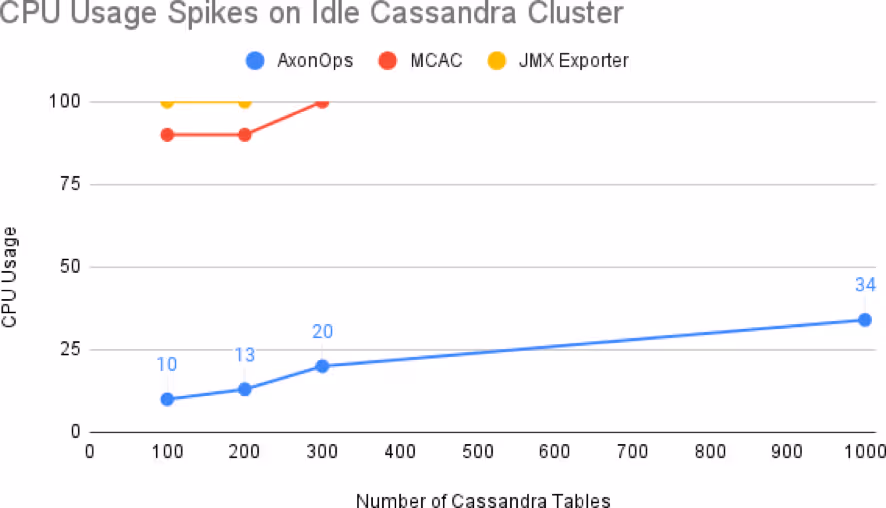
The JMX Exporter could barely monitor 100 tables, while the MCAC exporter could comfortably monitor 300 idle tables within the test environment. The AxonOps agent, on the other hand, could easily monitor more than 1000 tables while causing a 15-minute average load of around 0.33.
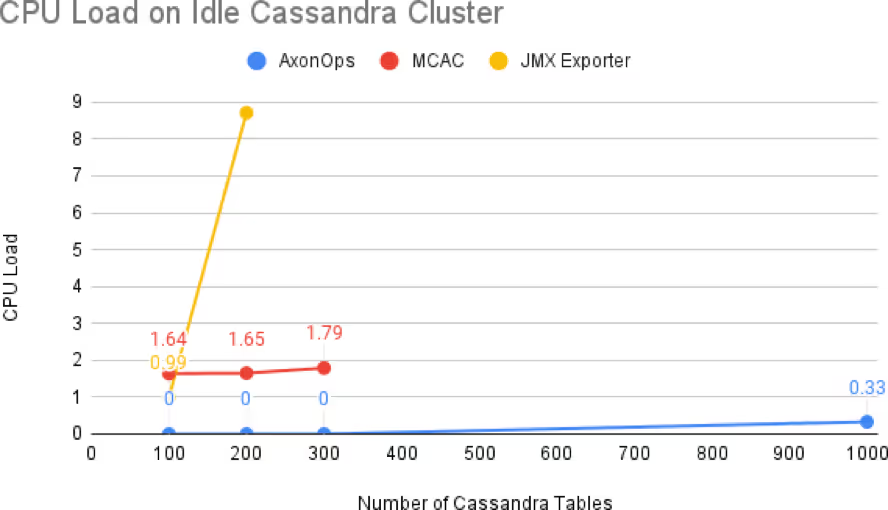
The majority of clusters typically have 100 tables or less. However, it is commonplace to have clusters with 1000 tables or more. I have personally worked in environments with these edge cases and being able to effectively monitor them with AxonOps is truly impressive. While this test is being run on nodes with 2 CPUs, the JMX Exporter may not be ideal for some enterprise-level configurations without proper performance testing.
It’s worth mentioning that the nodes using the MCAC Exporter were experiencing spikes related to the collectd process, which is listed as a known issue on DataStax’ website. Since these spikes were occurring outside the JVM, it allowed the Cassandra process to perform better than the nodes where the JMX Exporter is being used from within the JVM.
I lowered the number of tables on the cluster monitored by MCAC to 100 tables to match what the JMX exporter was monitoring while leaving the cluster monitored by AxonOps with 1000 tables in a better attempt to see load fluctuations for the rest of the tests.
Data Transfer over 24 Hours
I decided to run another test to see how much data is transmitted over 24 hours of uptime now that AxonOps is monitoring 1000 tables. This test would give me a chance to reconfirm my original measurements of MCAC’s exported data size.
AxonOps is also still remarkably lightweight on network bandwidth consumption, using 14% of the bandwidth JMX Exporter uses and 0.38% of the bandwidth of the MCAC Exporter. All while the AxonOps agent is still exporting metrics and logs for 10x more tables than the clusters being monitored by the MCAC and JMX Exporters.
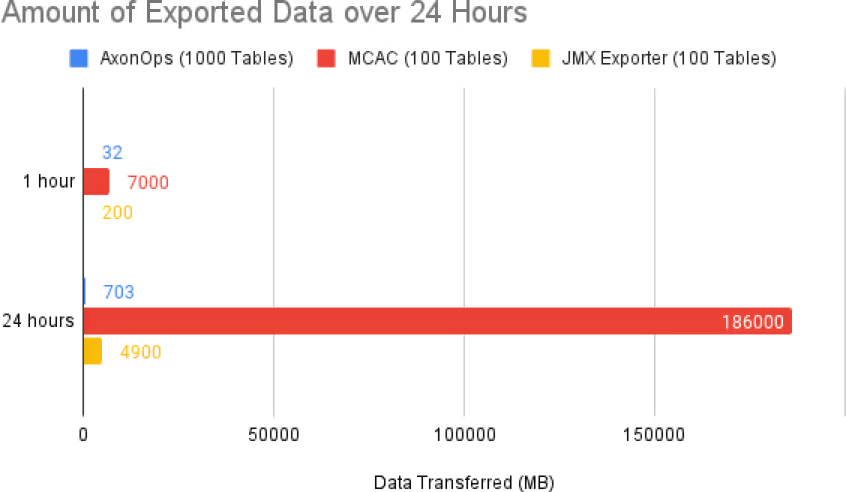
I wouldn’t advise using the MCAC exporter in a production environment until compression is enabled by default or you’ve added your own compression layer if bandwidth is a concern. The sole consumer of bandwidth off any database system should always be the data, not operational visibility tools.
Client-Side Overhead
Introducing visibility into your critical infrastructure at the expense of lower request throughputs is also not ideal. Next, we’ll test 3 workloads to compare the performance of an all-writes workload, an all-reads workload, and a mixed workload using the standard cassandra-stress tool.
Note that the AxonOps agent continues to be disadvantaged by having to monitor 1000 tables while the other exporters are only monitoring 100 tables.
Simple Workload: 1 Million Writes
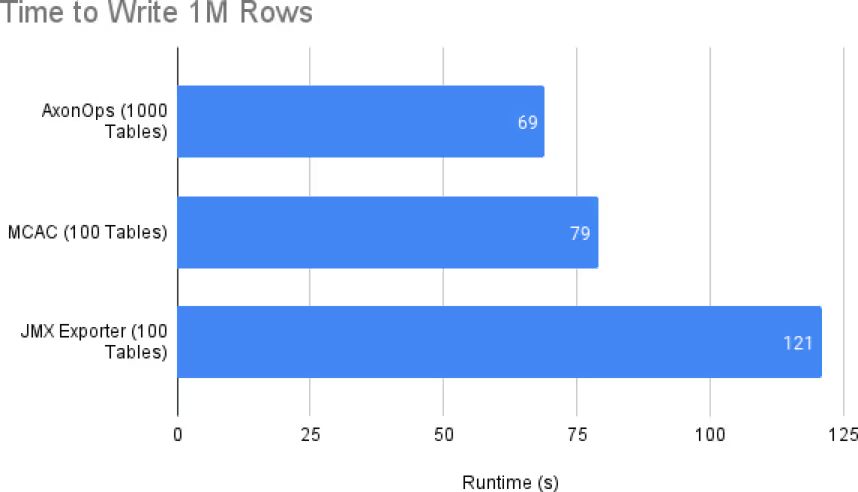
Before we can test the runtime and throughput of 1 million reads, we must populate the database with at least 1 million writes. After a few runs to warm up the Cassandra process, the following results were captured.
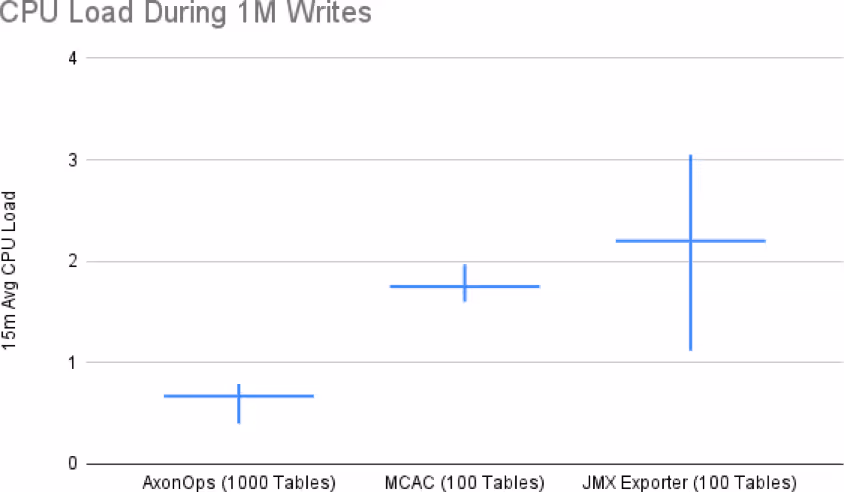
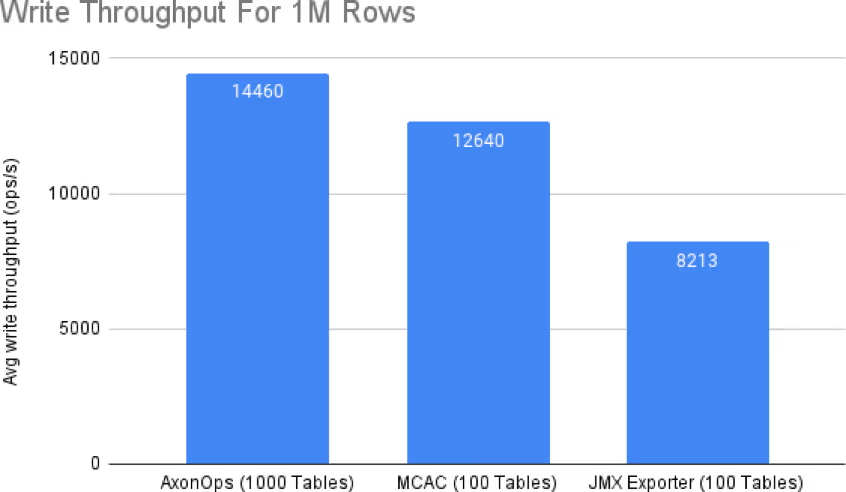
For 1 million writes, I was surprised to find the JMX Exporter dramatically lowering the write throughput for the cluster.
I ran all commands at the same time from a node with 4 CPUs. Technically, it’s not a fair assessment since whichever process is finished last could have a slight advantage in overall metrics since they can consume all CPU resources without contention. This possible advantage did not seem to be present.
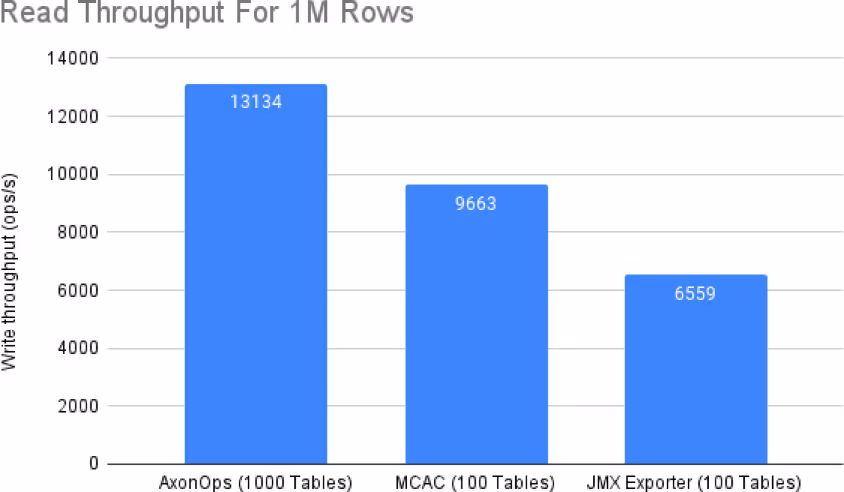
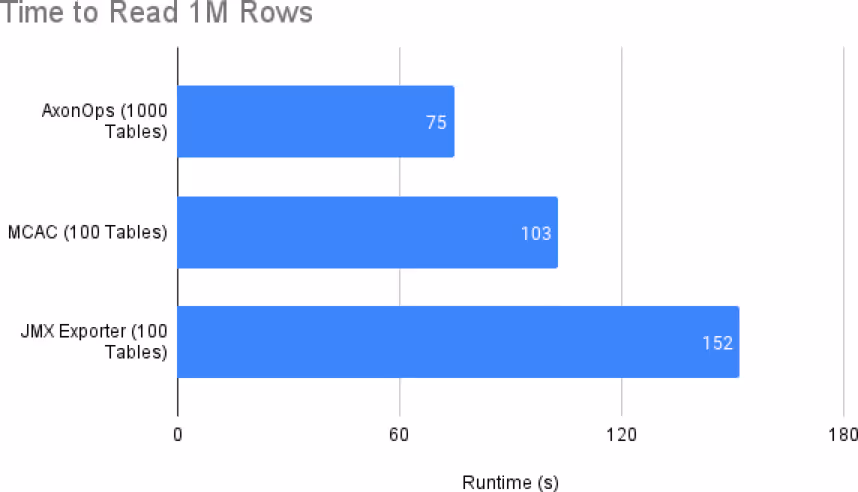
Simple Workload: 1 Million Reads
After there was around 1GB in each Cassandra node, I began testing the cluster’s read throughput.
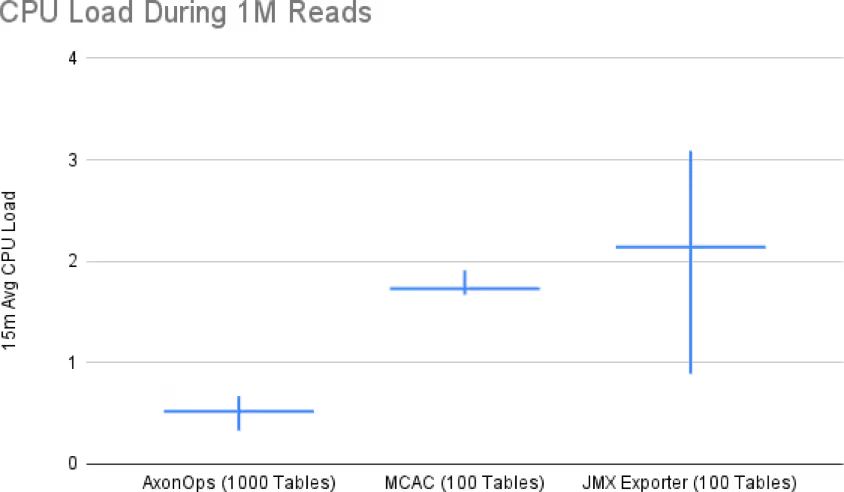
Usually, writing to Cassandra is limited by the CPU, while reading is limited by disk throughput. So, I thought the read speed would be about the same for the Cassandra clusters tracked by the AxonOps agent and MCAC exporter since 1 million read operations would apply disk pressure rather than CPU pressure.
However, remember that the MCAC exporter writes 5 GB of metrics to disk by default. This explains the relatively fast metric scrape times of 200 ms, but this metrics cache might also be the reason for Cassandra’s lower read throughput since we have two processes making disk I/O requests.
These two simple workloads highlighted that within our test environment, the JMX Exporter:
- could not monitor 100 tables without degrading performance
- failed to serve computed metrics
The scrape_timeout of 5 seconds ended up being too short, and all requests for metrics would timeout. Even though Prometheus was no longer receiving metrics from the JMX Exporter, Prometheus was still scraping the JMX Exporter and causing the load on the Cassandra cluster to produce the requested metrics that would ultimately be lost behind a timeout.
From experience, learning that your Cassandra metrics are no longer being ingested during a P0 outage is highly stressful. Given that the JMX Exporter is doubling the read and write latency while also not providing any insights into the cluster, I definitely won’t be installing the JMX Exporter on my cluster.
Mixed Workload: 5M Writes and 1.1M Reads
For this final test to be more inclusive, I decided to lower the number of tables that the MCAC and JMX Exporters have to monitor to 50 tables. I left the AxonOps agent monitoring 1000 tables since it didn’t seem like it would be an issue.
I used these commands to generate the read and write load from a 4-vCPU node:
T=2; N=5000000; A=
tools/bin/cassandra-stress \
write \
n=${N} \
-node 10.0.1.${A} \
-mode native cql3 \
user=cassandra password=cassandra \
-rate threads=${T} \
-log file=write-${A}-$(date +%s).log \
-graph file=write-${A}-$(date +%s).html

T=2; N=1100000; A=
tools/bin/cassandra-stress \
read n=${N} \
-node 10.0.1.${A} \
-mode native cql3 \
user=cassandra password=cassandra \
-rate threads=${T} \
-log file=read-${N}-$(date +%s).log \
-graph file=read-${N}-$(date +%s).html
Each of the 4 vCPUs rarely surpassed 70% utilization, indicating zero CPU contention for the load generators.
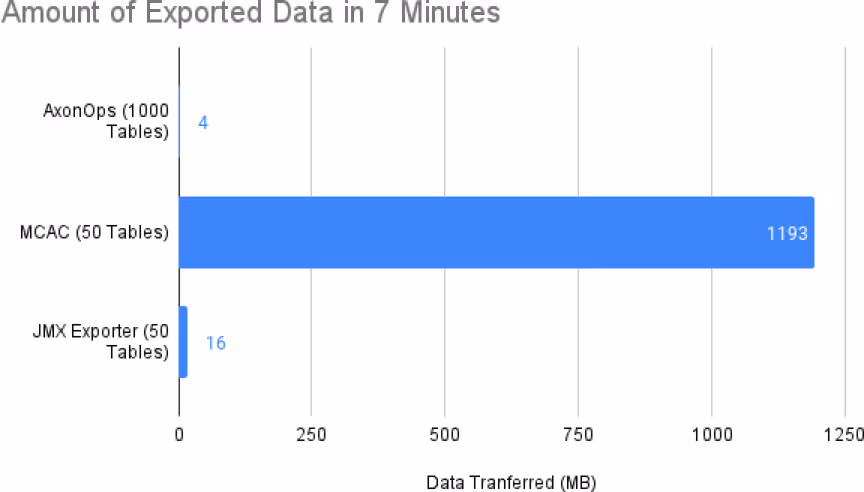
It was surprising to see that within 7 minutes, 1 GB of data was transferred by the MCAC exporter while only 4 MB were sent by the AxonOps agent.
The mixed workload finally caused the cluster monitored by AxonOps to have an average CPU load higher than 1, denoting a slight CPU contention.
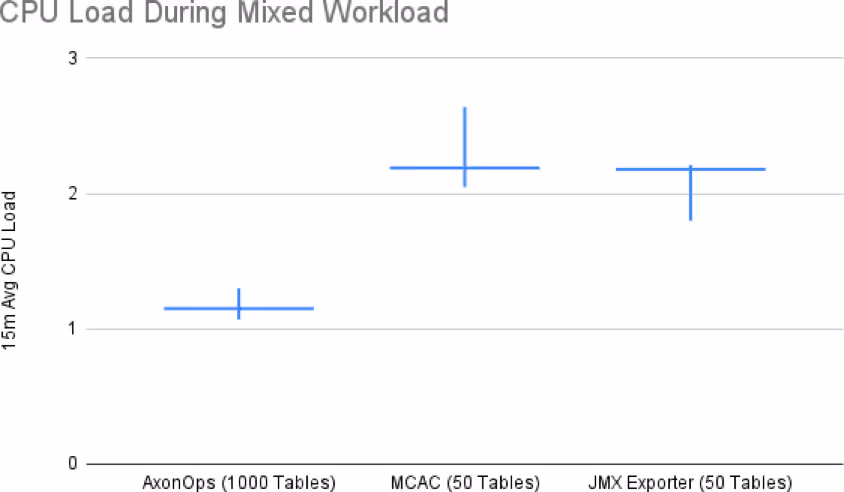
The cluster monitored by AxonOps continues to outshine the throughput of the other two clusters in mixed workload scenarios.
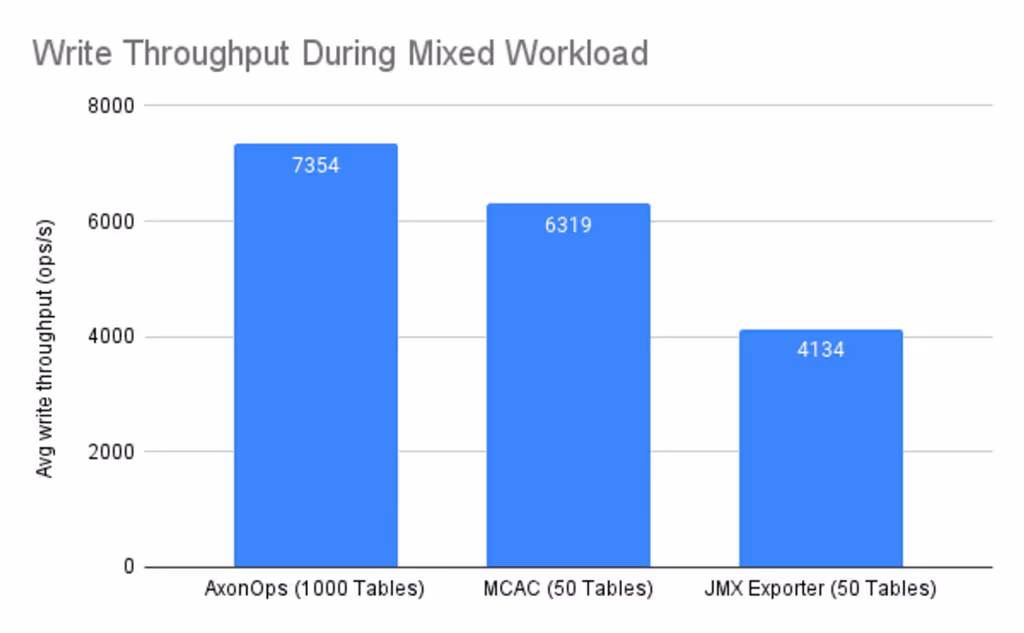
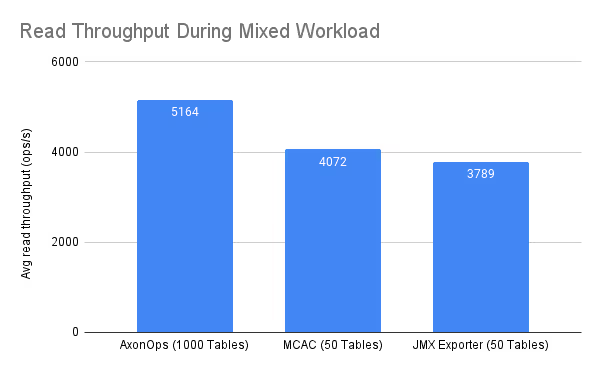
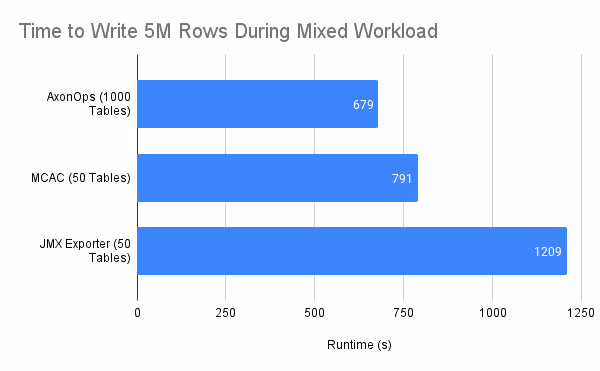
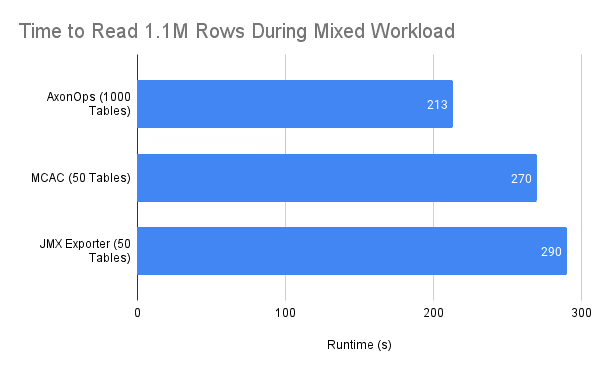
Given that the JMX Exporter caused reads and writes to be slower, it comes as no surprise that the JMX Exporter caused mixed workload throughput to be equally taxed.
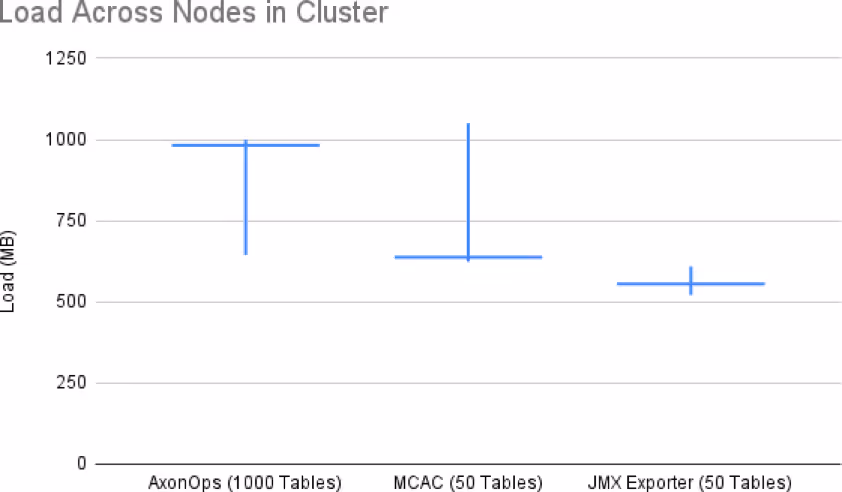
Testing Artifacts: Data Load
Throughout the test setup process, the load tests were started and manually terminated multiple times. Since the cluster monitored by AxonOps accepted a higher write throughput, it ended up having almost twice as much data as the cluster monitored by the JMX Exporter. So even while the cluster monitored by AxonOps held twice as much data while housing 20x as many tables, the cluster still processed twice as many reads and writes as the clusters monitored by the MCAC and JMX Exporter.
Honorable Mentions
DataDog
I also considered testing the DataDog agent as well. I decided not to look further into DataDog since the DataDog agent would only be collecting node-level data and not the table-level data that is useful in quickly spotting issues with resource-hungry tables and workloads. While I trust DataDog’s reliability and ability to offer org-wide metrics, if Cassandra lies in your critical path, you would ideally also capture Cassandra table-level metrics to be able to quickly and effectively diagnose P0’s.
Instaclustr
Instaclustr was not evaluated at this time since multiple attempts to create 100 tables failed with BufferOverflowExceptions within the Cassandra logs. When the JMX and MCAC Exporters were monitoring 100 tables, the CPU load was higher but the metrics continued reporting. When the Instaclustr exporter encountered the BufferOverflowException, metrics reporting stopped completely.
Further tests showed that the Instaclustr agent was able to monitor at least 50 tables within the test environment, but each test failed with the same Cassandra-side BufferOverflowException before 75 tables were created.
Interestingly enough, Instacluster’s documentation has no recommendations to limit the number of tables per cluster, while their cassandra-exporter documentation claims to support 1000+ tables exporting 174,000 metrics.
The nodes consumed about 1.5 GB of the allotted 8 GB heap, the CPU consumption was low, and they were all running the same Java versions as the rest of the test clusters.
Conclusion
It should first be noted that AxonOps had a few disadvantages throughout the tests as follows:
- The AxonOps agent was:
- Monitoring 1000 tables, instead of 50 or 100 tables
- The Cassandra cluster that was monitored by the AxonOps had:
- 1000 tables, instead of 50 or 100 tables
- 50-100% more data load, due to a higher write throughput in timed tests
The fact the AxonOps agent still managed to outperform the MCAC exporter and the JMX Exporter is impressive.
The cluster being monitored by the JMX Exporter only had 50 tables, while the cluster monitored by the AxonOps agent was still able to:
- process 2x as many writes
- perform 40% quicker reads
- continue providing updated metrics every 5 seconds
The write throughput of the MCAC exporter looks comparable to the AxonOps agent when the number of tables being monitored is kept low. However, the following issues with the MCAC exporter are noteworthy when making final comparisons since the MCAC exporter:
- cannot monitor more than 300 keyspace/table pairs, within this test environment
- sends 220-260x more data than the AxonOps agent
- shows a 20% drop in read-throughput, likely due to the on-disk metrics caching enabled by default
These results speak to the lightweight, unobtrusive nature of the AxonOps agent that has been built from the ground up with metric collection optimizations, compression, and resource usage being at the center of the design process and zero-configuration installation.
I’m looking forward to using AxonOps on my current Cassandra cluster, and the next. It’s nice not having to trade visibility for lower throughputs with a higher bandwidth bill.
The AxonOps agent is the clear winner in this specific test.